resource consumption: in numbers
These two infographics which concisely present water and electricity usage of the average Croat and Lithuanian. Using these facts and useful tips we hope to encourage people to start more carefully and smartly use energetics, with a goal of leading to conservation habits.
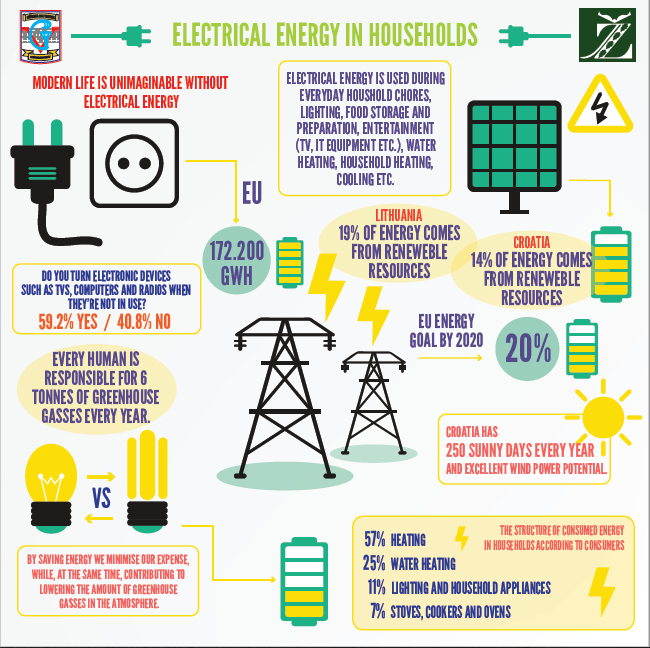
In the first infographic – „Electrical Energy in Households“ we showed how the average Croat and Lithuanian use energy. It also includes a few tips on how to smartly use electricity.
|
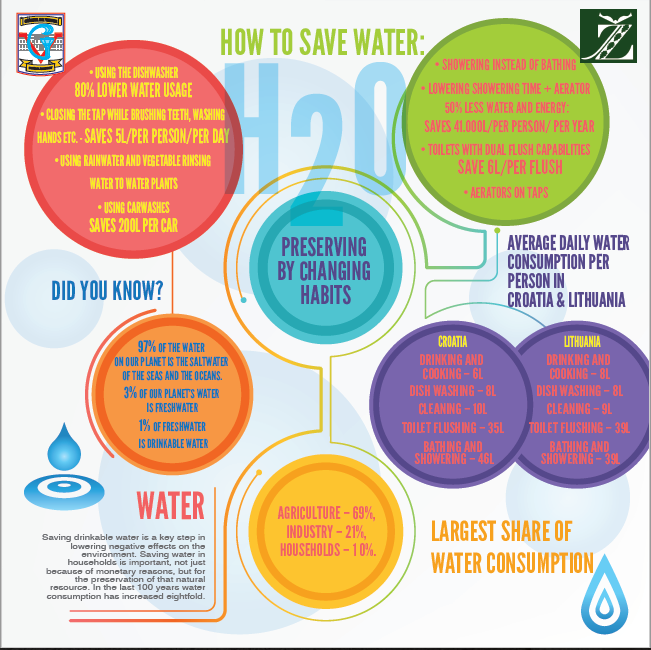
In the second infographic – „How to Save Water“ we showed the average water consumption in Croatian and Lithuanian households, just as ways in which we can save water.
|
